Class Size Statistics & Trends: Visualized & Curated [2024]

The typical class size in US public schools is 16-23 students. In the academic year 2020-2021, the mean class size was 18.3 students, a slight decrease from the 2017-2018 average of 19.6 students. These figures represent the mean across both primary and secondary education.
The Organization for Economic Cooperation and Development (OECD) reports an average class size of about 20 students for all OECD countries’ primary education. The European Union (EU) average is slightly lower at 19 students.
A review of OECD and US data suggests a minor decline in class sizes in the US and OECD countries since 2012. Despite a slight increase in the US at the onset of the 2010s, the trend reversed in 2012. Nevertheless, the fluctuations have been minor; the mean class size in primary education in both the US and the OECD average has hovered around 20 students since 2005. The EU average has consistently stayed slightly lower, at around 19 students during the same timeframe.
[Because the statistics data lags by a few years, depending on the source, we don’t have data for 2023 and 2022, even though the article was last updated in early 2024. We aim to keep the article current as new statistics become available.]
An Overview of Class Size Distribution Statistics in the US
Histograms provided represent class-size distribution in US public schools in 2017-2018 and 2020-2021, as provided by the National Center for Education Statistics. These graphs display the relative frequency of various class sizes.
The original data includes state averages for school levels (primary, middle, high) and class types (self-contained and departmentalized). A self-contained class is one where the teacher imparts all subjects to the same group of students, while in departmentalized classes, the teacher instructs one subject to different groups of students.
As these histograms are built upon already averaged data, they are not flawless representations of the actual class size distribution, as state-level variations may be hidden. Despite this, the data likely provides a reasonably accurate depiction of class size distribution in US public schools.
The class size distributions generally align well with the normal distribution (bell curve). The standard deviation of the distributions is approximately three students, meaning that about 68% of class sizes fall within plus or minus three students of the average class size.
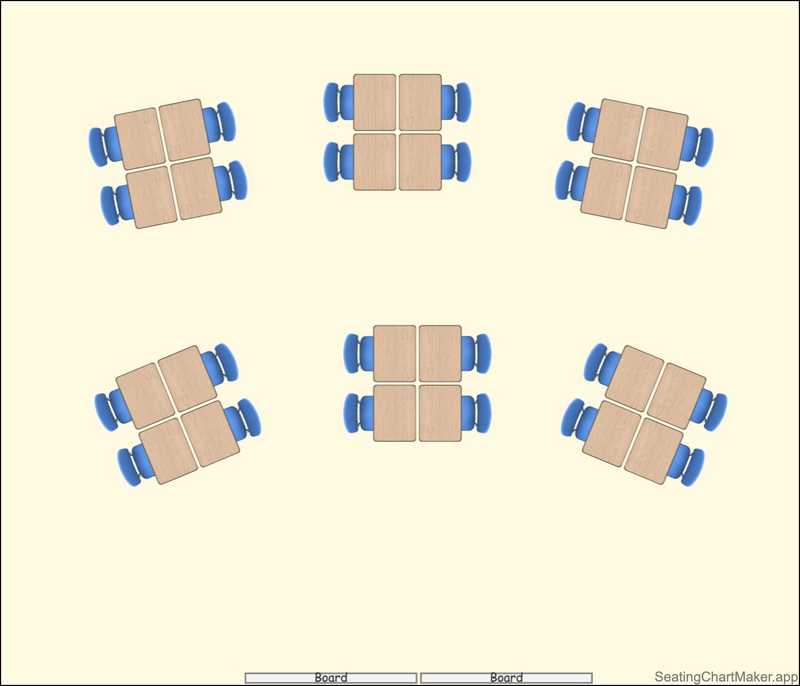
Planning for various class sizes can be challenging. To plan, manage and visualize seating arrangements, consider using a seating chart maker that simplifies the process.
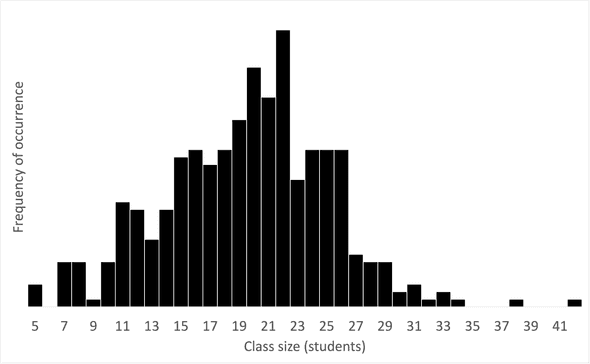
Class Size Distribution in US Public Schools: 2017-2018
In 2017-2018, the most common class size in US public schools was 20 students. The majority of class sizes were between 15 and 26 students. The histogram is slightly left-skewed, indicating a higher frequency of classes with 15-20 students than 20-25 students. The mean class size for this data was 19.6 students.
Class Sizes in US Public Schools: 2017-2018
On the distribution extremities, classes ranged from as few as five students to as many as 42 students. Note that these figures are not individual outlier classes or even schools but measured averages across all classes in a state, given the class type and school level. As such, there are likely classes with fewer than five students and others with more than 42 students.
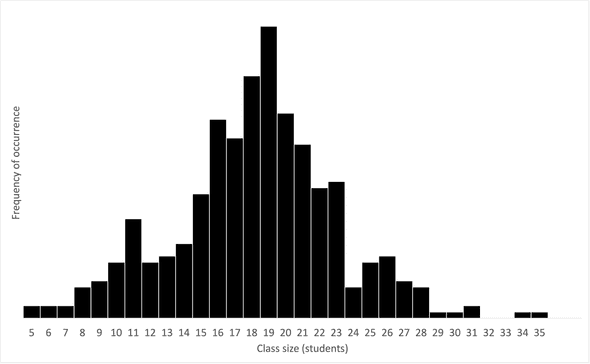
Class Size Distribution in US Public Schools: 2020-2021
In the 2020-2021 academic year, the most frequently observed class size in US public schools was 19 students, and most class sizes ranged from 15 to 23 students. The mean class size was 18.3 students.
Class Sizes in US Public Schools: 2020-2021
The 2020-2021 histogram appears symmetric, indicating no skew. We can see an apparent decrease in frequency after class sizes of 23, unlike the 2017-2018 histogram. Another notable observation is the spike at 11 students. These discontinuities may be attributable to class size policies in some states. We also see fewer state averages with class sizes of 30 or more in 2020-2021 than in 2017-2018, which may also reflect changing class size policies.
OECD Class Size Trends
Publicly accessible OECD statistics can be found at stats.oecd.org. The utilized OECD data pertains only to primary education and represents the average class size per country per year. Note that our US-specific histogram data includes both primary and secondary education. In addition, the OECD data incorporates both public and private education, unlike the histogram source data. Consequently, there may be discrepancies between the averages in the US distribution data and the trend data.
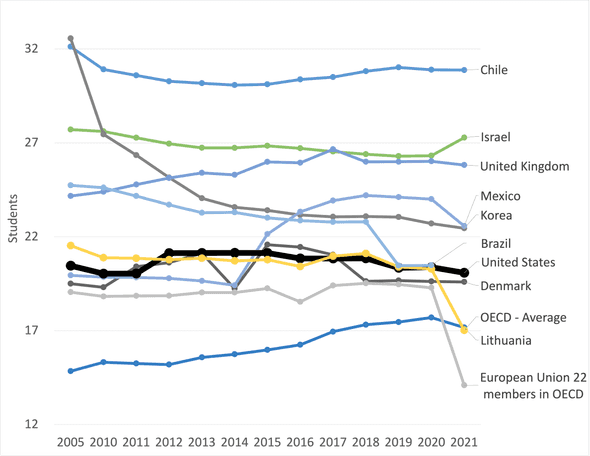
Primary Education Class Size in OECD Countries: 2005-2021
The OECD data illustrates that the mean class size in OECD countries has remained around 20 students since 2005. The EU average has been slightly lower, with approximately 19 students during the same period. The US average seems to strongly correlate with the OECD average over the years, likely due to the fact that the US is the most populous OECD country and having a significant weight on the average.
The graphs reveal a substantial decline in average class sizes in South Korea, decreasing from 33 students in 2005 to 23 in 2021. Countries like Chile and Israel consistently maintain larger class sizes, averaging 30 and 27 students, respectively. The data indicates that Baltic nations like Lithuania typically have smaller class sizes. The UK and Mexico are notable, as they not only exceed the OECD average in class size but have also seen an increase in recent years, deviating from the general downward trend. An interesting question is how much classroom sizes in square feet/meters correlate with class sizes.
In 2021 data, there are significant drops in some time series. The drop could be either due to the pandemic or incomplete data. To avoid cluttering the graph, we have omitted notable OECD countries. These include many European countries, such as France, Germany, Italy, Spain, and the Nordic countries, all of which have class sizes close to the OECD average.
Conclusion
In conclusion, the average class size in US public schools and OECD countries has decreased slightly over the past decade, with fluctuations remaining relatively minimal. Average class sizes have hovered around 20 students in both the US and OECD, while the EU average has been slightly lower, typically around 19 students.
It will be interesting to observe how these trends evolve over time. The COVID-19 pandemic and policy changes on class sizes worldwide may have a significant impact on future class size statistics. For educators and policymakers, understanding these trends is crucial for effective resource allocation and educational planning.


